Data visualization overview

Tyler George

Cornell College
DSC 223 - Spring 2024 Block 7

Warm up

Loading required package: ggplot2
── Attaching core tidyverse packages ────────────────────────────────── tidyverse 2.0.0 ──
✔ dplyr     1.1.4     ✔ readr     2.1.5
✔ forcats   1.0.0     ✔ stringr   1.5.1
✔ lubridate 1.9.3     ✔ tibble    3.2.1
✔ purrr     1.0.2     ✔ tidyr     1.3.1
── Conflicts ──────────────────────────────────────────────────── tidyverse_conflicts() ──
✖ dplyr::filter() masks stats::filter()
✖ dplyr::lag()    masks stats::lag()
ℹ Use the conflicted package (<http://conflicted.r-lib.org/>) to force all conflicts to become errors
Announcements

Questions from last time?

Questions from last time

Many of the questions in Lab 1 are subjective. How does that work?

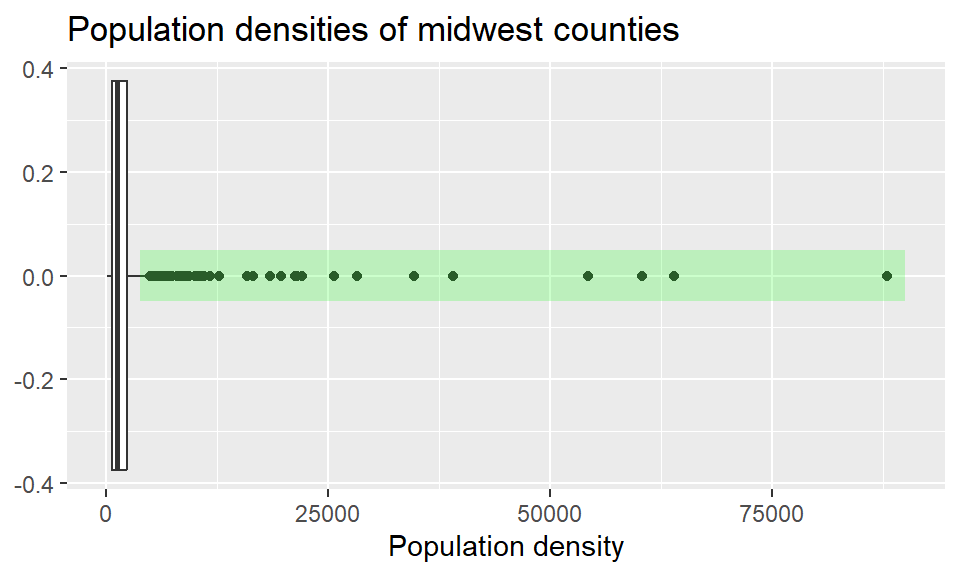
identify at least one outlier

Questions from last time

Many of the questions in Lab 1 are subjective. How does that work?

identify at least one outlier ✅

Questions from last time

Many of the questions in Lab 1 are subjective. How does that work?

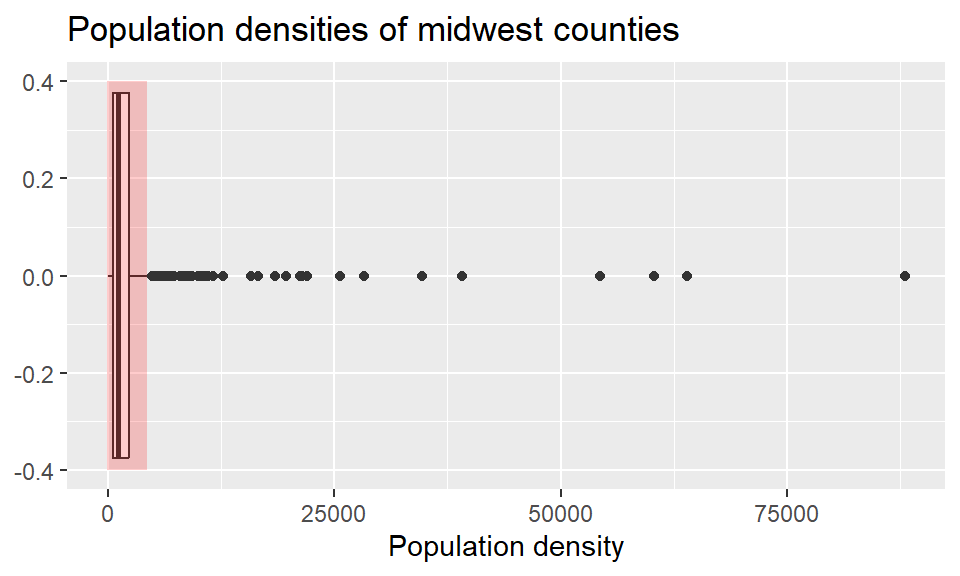
identify at least one outlier ❌

Questions from last time

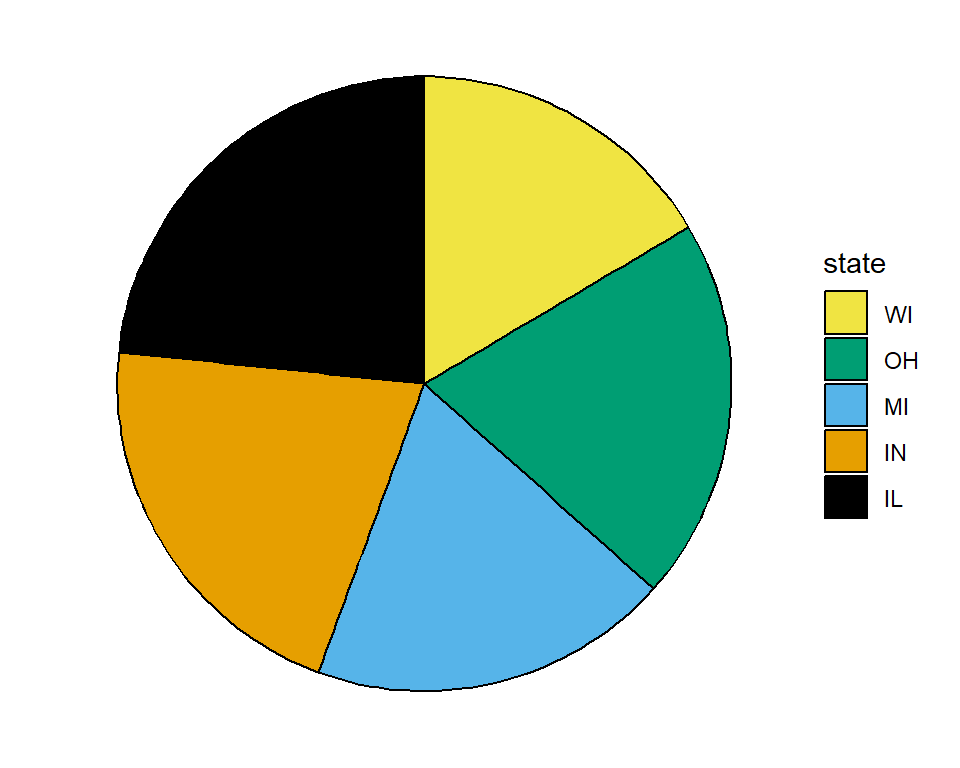
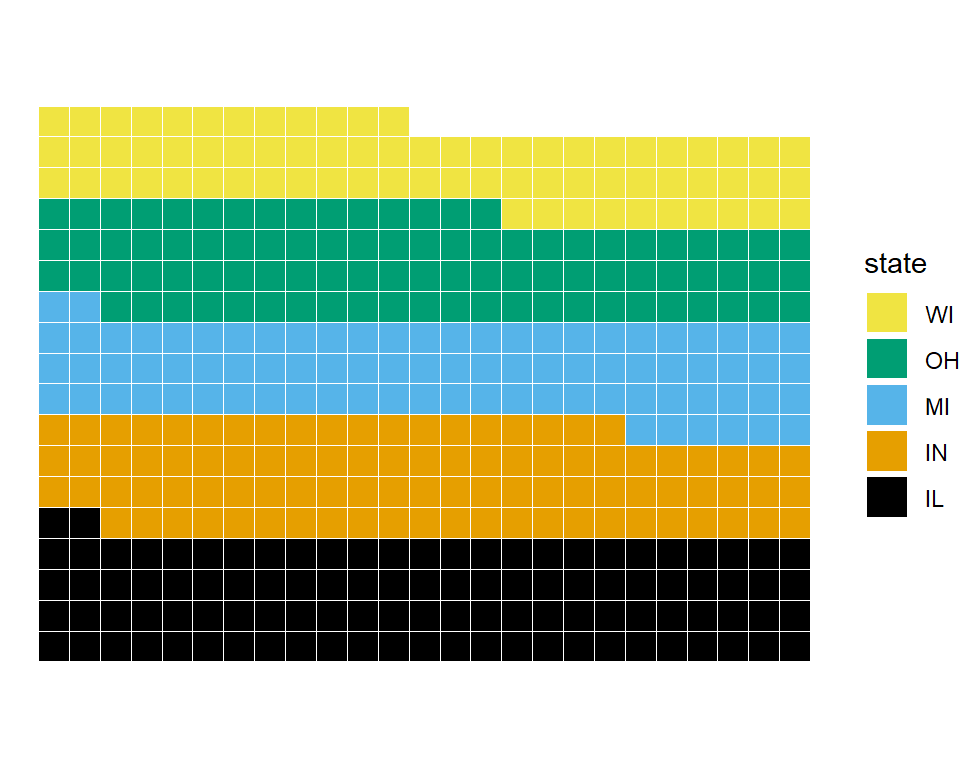
What are some situations where waffle plots are better than pie charts?

Let’s take a look at an example…

🥧 or 🧇?

Which of the following is a better representation for the number of counties in each midwestern state?

🥧 or 🧇 or ?

Which of the following is a better representation for the number of counties in each midwestern state?

midwest |> 
  count(state, sort = TRUE)
# A tibble: 5 × 2
  state     n
  <chr> <int>
1 IL      102
2 IN       92
3 OH       88
4 MI       83
5 WI       72

Review

Packages

library(palmerpenguins)
library(tidyverse)
library(ggthemes)

Bivariate analysis

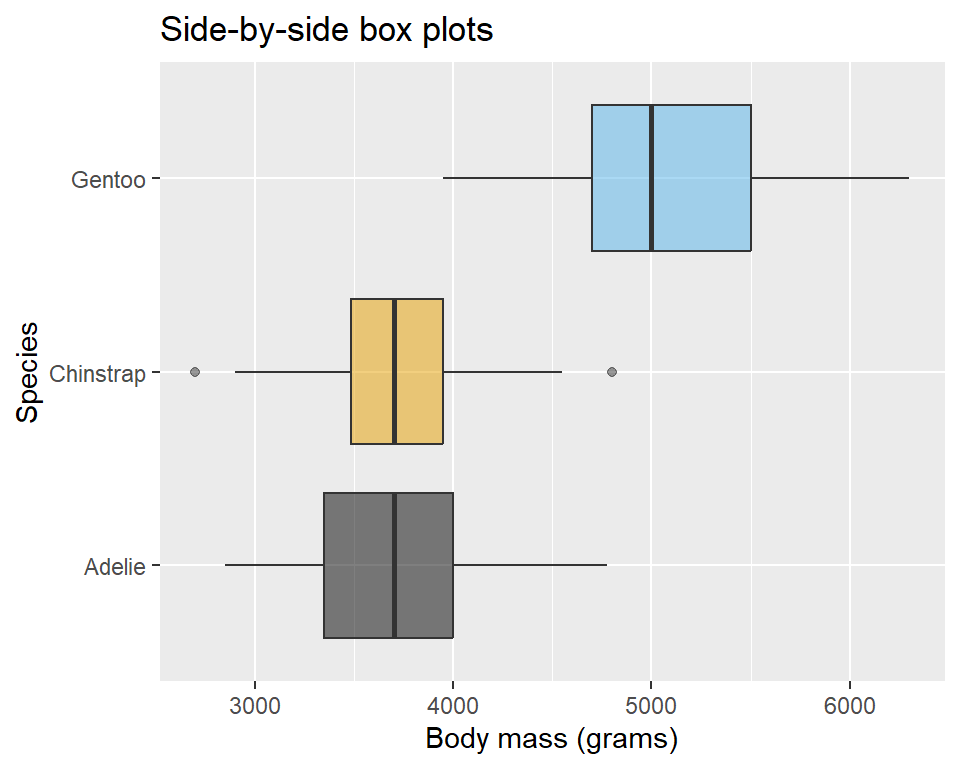
# Side-by-side box plots
ggplot(penguins, aes(x = body_mass_g, y = species, fill = species)) +
  geom_boxplot(alpha = 0.5, show.legend = FALSE) +
  scale_fill_colorblind() +
  labs(
    x = "Body mass (grams)", y = "Species",
    title = "Side-by-side box plots"
  )
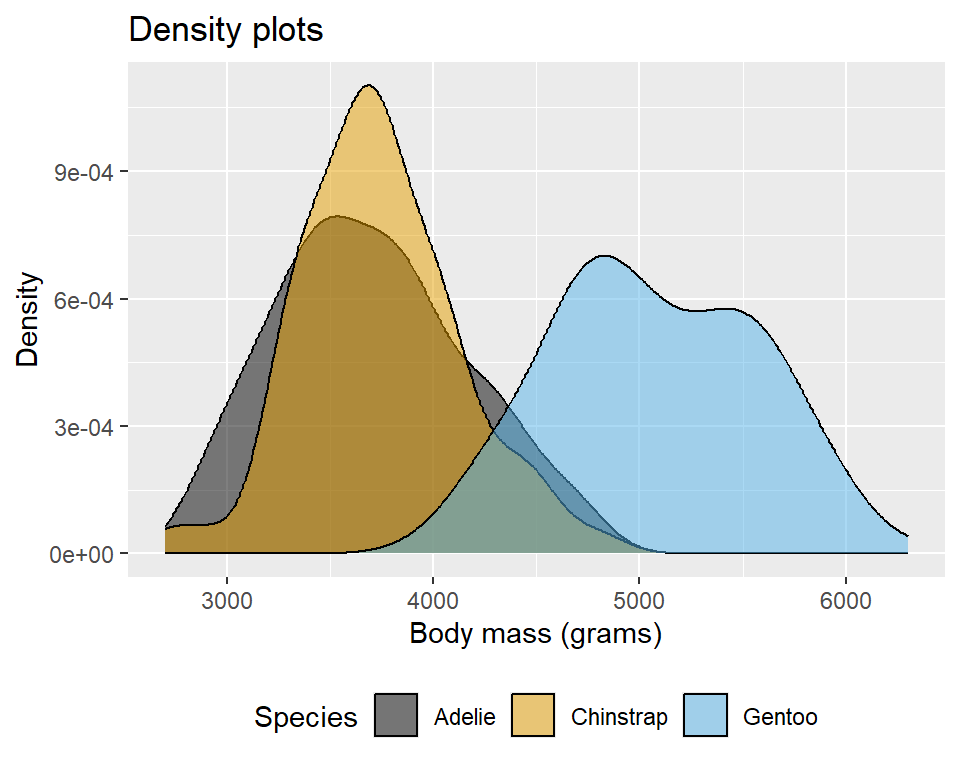
# Density plots
ggplot(penguins, aes(x = body_mass_g, fill = species)) +
  geom_density(alpha = 0.5) +
  theme(legend.position = "bottom") +
  scale_fill_colorblind() +
  labs(
    x = "Body mass (grams)", y = "Density",
    fill = "Species", title = "Density plots"
  )

Violin plots

ggplot(
  penguins,
  aes(
    x = species,
    y = body_mass_g
    )
  ) +
  geom_violin()
Warning: Removed 2 rows containing non-finite outside the scale range
(`stat_ydensity()`).

Multiple geoms

ggplot(
  penguins,
  aes(
    x = species,
    y = body_mass_g
    )
  ) +
  geom_violin() +
  geom_point()

Multiple geoms

ggplot(
  penguins,
  aes(
    x = species,
    y = body_mass_g
    )
  ) +
  geom_violin() +
  geom_jitter()

Multiple geoms + aesthetics

ggplot(
  penguins,
  aes(
    x = species,
    y = body_mass_g,
    color = species
    )
  ) +
  geom_violin() +
  geom_jitter()

Multiple geoms + aesthetics

ggplot(
  penguins,
  aes(
    x = species,
    y = body_mass_g,
    color = species
    )
  ) +
  geom_violin() +
  geom_jitter() +
  theme(
    legend.position = "none"
  )

Multiple geoms + aesthetics

ggplot(
  penguins,
  aes(
    x = species,
    y = body_mass_g,
    color = species
    )
  ) +
  geom_violin() +
  geom_jitter() +
  theme(
    legend.position = "none"
  ) +
  scale_color_colorblind()

Multivariate analysis

Bechdel

Load the Bechdel test data with read_csv():

bechdel <- read_csv("https://sta199-s24.github.io/data/bechdel.csv")


View the column names() of the bechdel data:

names(bechdel)
[1] "title"       "year"        "gross_2013"  "budget_2013" "roi"         "binary"     
[7] "clean_test" 

ROI by test result

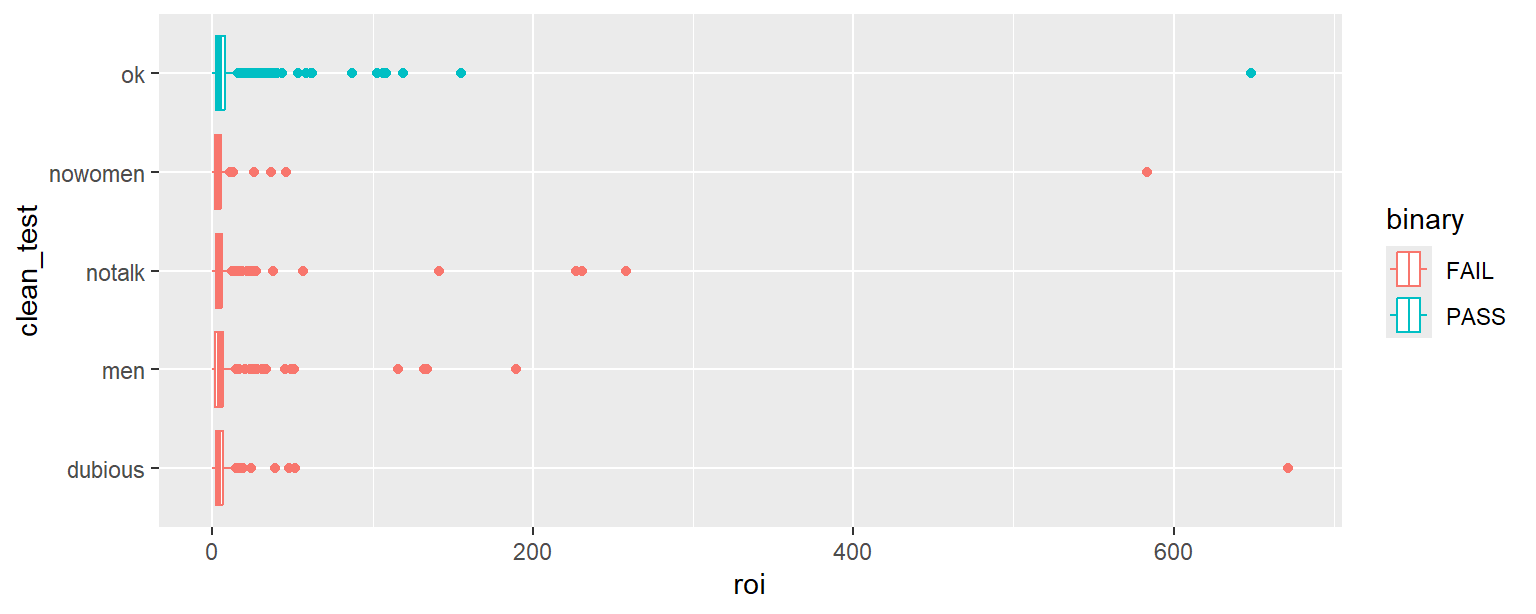
What about this plot makes it difficult to evaluate how ROI varies by Bechdel test result?

ggplot(bechdel, aes(x = roi, y = clean_test, color = binary)) +
  geom_boxplot()
Warning: Removed 15 rows containing non-finite outside the scale range
(`stat_boxplot()`).

Movies with high ROI

What are the movies with highest ROI?

bechdel |>
  filter(roi > 400) |>
  select(title, roi, budget_2013, gross_2013, year, clean_test)
# A tibble: 3 × 6
  title                     roi budget_2013 gross_2013  year clean_test
  <chr>                   <dbl>       <dbl>      <dbl> <dbl> <chr>     
1 Paranormal Activity      671.      505595  339424558  2007 dubious   
2 The Blair Witch Project  648.      839077  543776715  1999 ok        
3 El Mariachi              583.       11622    6778946  1992 nowomen   

ROI by test result

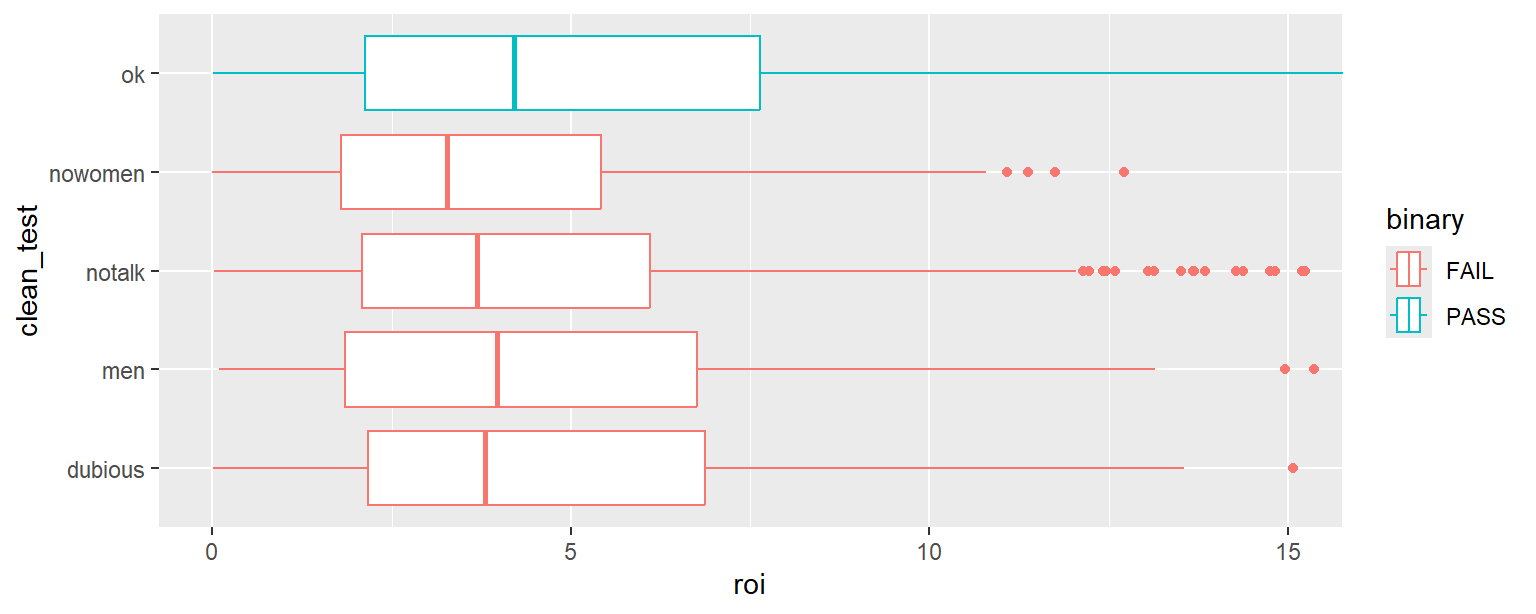
Zoom in: What about this plot makes it difficult to evaluate how ROI varies by Bechdel test result?

ggplot(bechdel, aes(x = roi, y = clean_test, color = binary)) +
  geom_boxplot() +
  coord_cartesian(xlim = c(0, 15))

Median ROI

bechdel |>
  summarize(median_roi = median(roi, na.rm = TRUE))
# A tibble: 1 × 1
  median_roi
       <dbl>
1       3.91

Median ROI by test result

bechdel |>
  group_by(clean_test) |>
  summarize(median_roi = median(roi, na.rm = TRUE))
# A tibble: 5 × 2
  clean_test median_roi
  <chr>           <dbl>
1 dubious          3.80
2 men              3.96
3 notalk           3.69
4 nowomen          3.27
5 ok               4.21

ROI by test result – zoom in

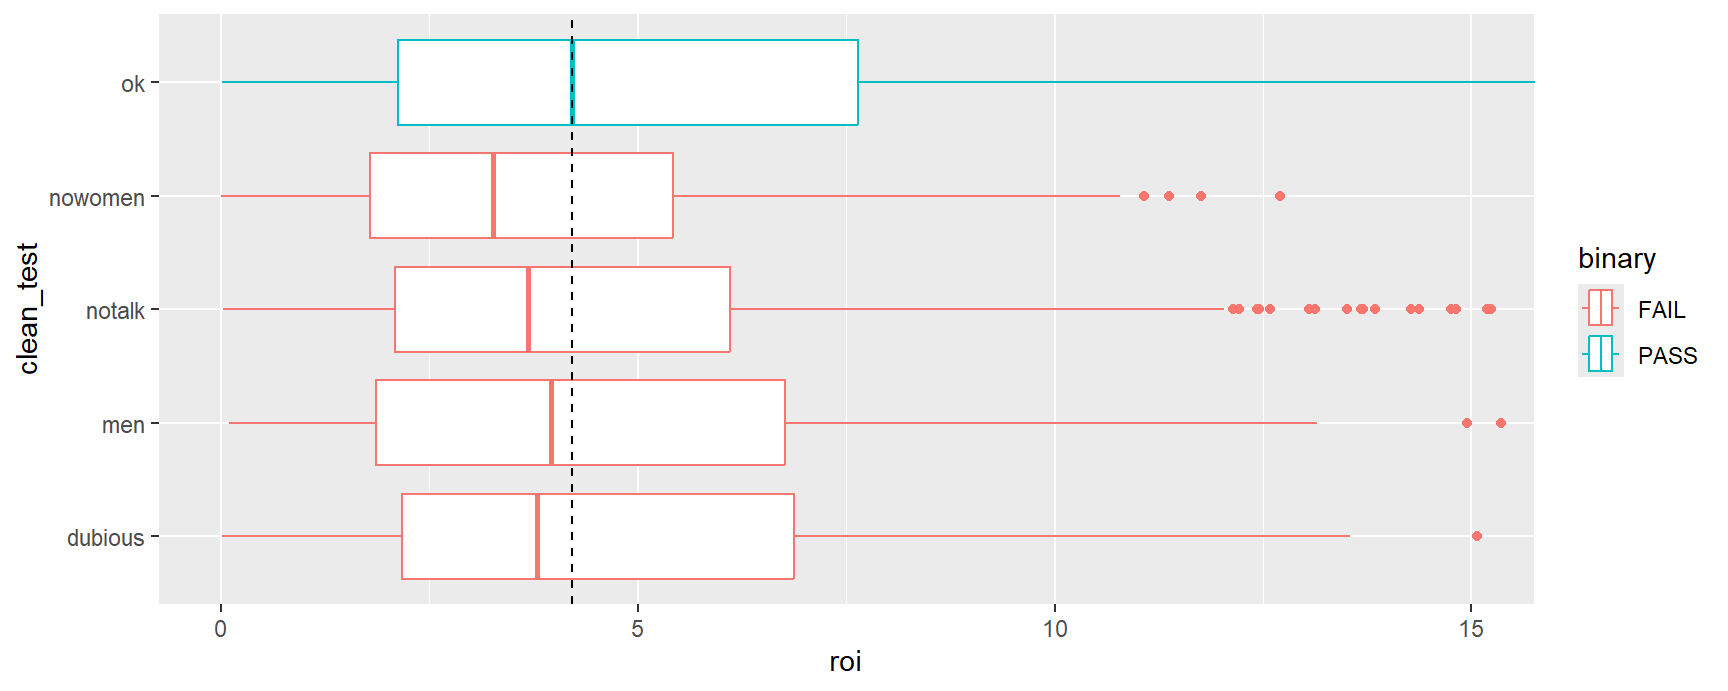
What does this plot say about return-on-investment on movies that pass the Bechdel test?

ggplot(bechdel, aes(x = roi, y = clean_test, color = binary)) +
  geom_boxplot() +
  coord_cartesian(xlim = c(0, 15)) +
  geom_vline(xintercept = 4.21, linetype = "dashed")

Application exercise

ae-03-duke-forest

Go to Github and find the repo with the name ae-03-duke-forest appended by your username.

Clone the repo, and open the Quarto document called ae-03-duke-forest.